
Dfree · Financial education
People said the platform was fine. So why weren’t they finishing?
Redesigning a nonprofit’s online academy by watching what learners did, not only what they said.
- Role
- Sole UX/UI designer and UX researcher; also acted as product manager and led video production
- Partners
- Project manager, web designer, IT support, director of finance and operations, academy manager
- Timeline
- 2022
- Status
- Shipped, launched October 2022
The Dfree Global Foundation is a nonprofit working to lead the African American community to financial freedom through content, curriculum, training, tools and access to professionals. In 2021 it launched the first class of the dfree® Online Academy, its learning platform. At the end of the year, the founder and investors reviewed the analytics and were concerned about enrollment and completion. Their answer was to redesign the platform.
The brief came to me as a question: How might we redesign our learning platform so that more people enroll and graduate? Before redesigning anything, I wanted to know what was actually going wrong, and I suspected the answer would depend on who I asked and how.
- 01What were people saying?
- 02What were they doing?
- 03What would make it easier to finish?
- 04Did the redesign actually work?
A platform no one complained about
The stakeholders described the audience as church-going African American women aged 45 to 75. They wanted a significant increase in enrollment and in graduation, within about six months.
The data showed why they were worried. I synthesized a collection of earlier analytics spreadsheets into two numbers: in 2021, 3,692 people enrolled in the academy, and 599 graduated. That is a graduation rate of about 16%.
So the platform had a completion problem. But when I talked to learners, almost no one described one.
What were people saying?
I started with interviews. Graduates had been the most responsive group, so I wrote ten questions and sat down with six academy graduates to understand their experience of the platform.
When we asked participants to rate their overall experience, most had no complaints. On what people said alone, the platform was fine.
What were they doing?
There can often be a difference between what users say and what they actually do. So I recruited six more people for a moderated usability study, to surface needs and challenges people weren’t aware of, and therefore couldn’t put into words.
I measured three things: time on task, lostness (how far someone strays from the most direct path, where 0 is a straight line and anything up to 0.40 is the goal), and the System Usability Scale.
Many participants appeared visibly frustrated. On average, signing up for the academy took 4 minutes 47 seconds, and the longest attempt took 11 minutes 33 seconds. Finding and enrolling in the right course produced an average lostness score of 0.90. The System Usability Scale score was 74.
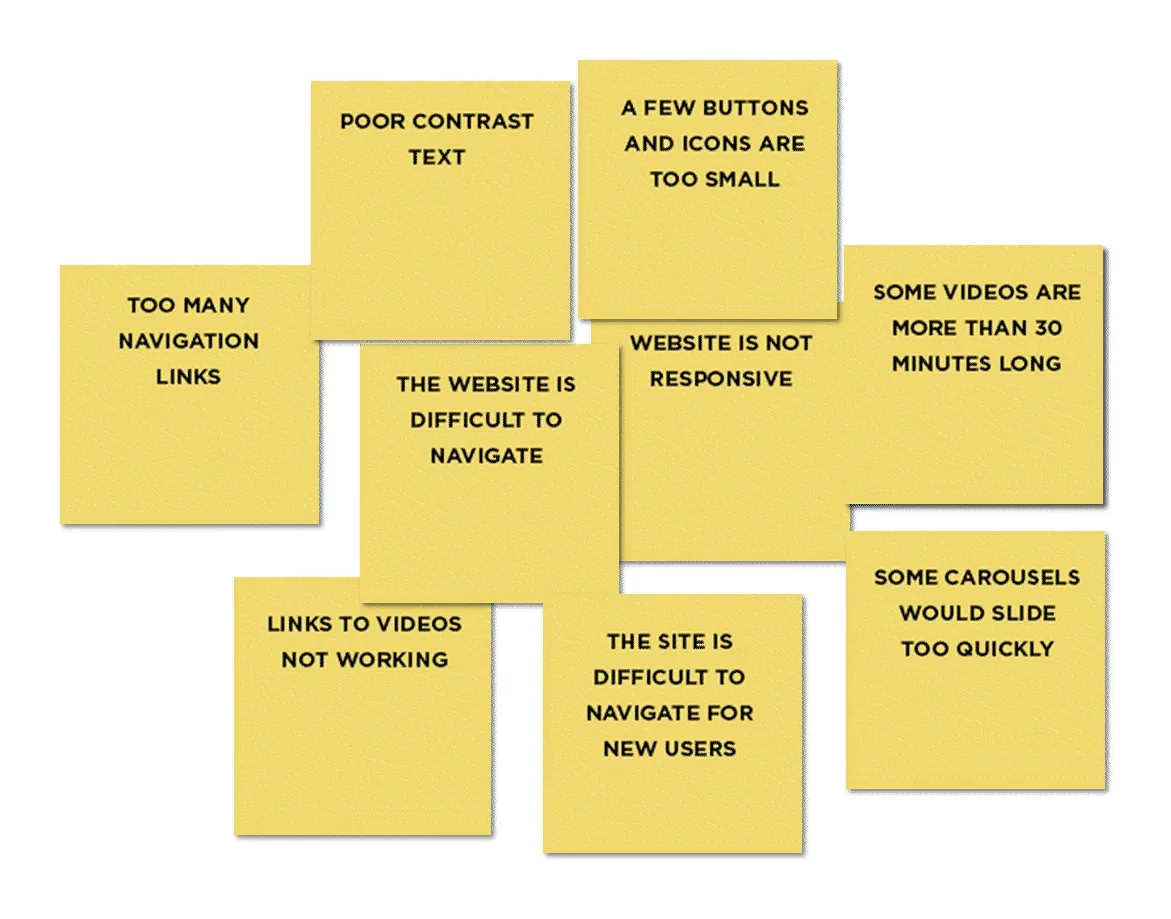
Together, the interviews and the study pointed to two kinds of pain points. Usability: links to videos that didn’t work, pages that were hard to navigate, especially for new users, and some videos longer than 30 minutes. Accessibility: carousels that slid too quickly, poor text contrast, buttons and icons that were too small, too many navigation links, and pages that didn’t work on phones.
I also looked at the platforms our learners already knew. Half of the people I interviewed had taken Dave Ramsey’s Financial Peace University or a Coursera course. Those platforms showed real data on how well their courses work, gave an overview of what participants would get from a course, and featured testimonials on their homepages.
What would make it easier to finish?
With the pain points clear, I sat down with the project manager, web designer, director of finance and the academy manager to work through solutions together.
- CEO and founder
- Sponsors
- Director of finance and operations
- Academy manager
- Web designer
- Salesforce operations manager
- IT support specialist
- Project manager
- Relationship manager
We framed two questions.
How might we motivate more people to enroll and complete the academy by making it easier to use?
- Simplify the flows for registering and finding courses
- Make the courses more clearly distinct from each other
- Build courses around microlearning
- Build in surveys that tell us how people are doing in their courses
How might we make the platform more inclusive and accessible?
- Use images that are more representative of our learners
- Make every page responsive
- Give videos a subtitle option
In the redesign, we simplified processes and focused on navigation, from enrollment down to pages like Contact. We also used it as a chance to show learners we were thinking about them: a new accessibility page and subtitles on course videos.
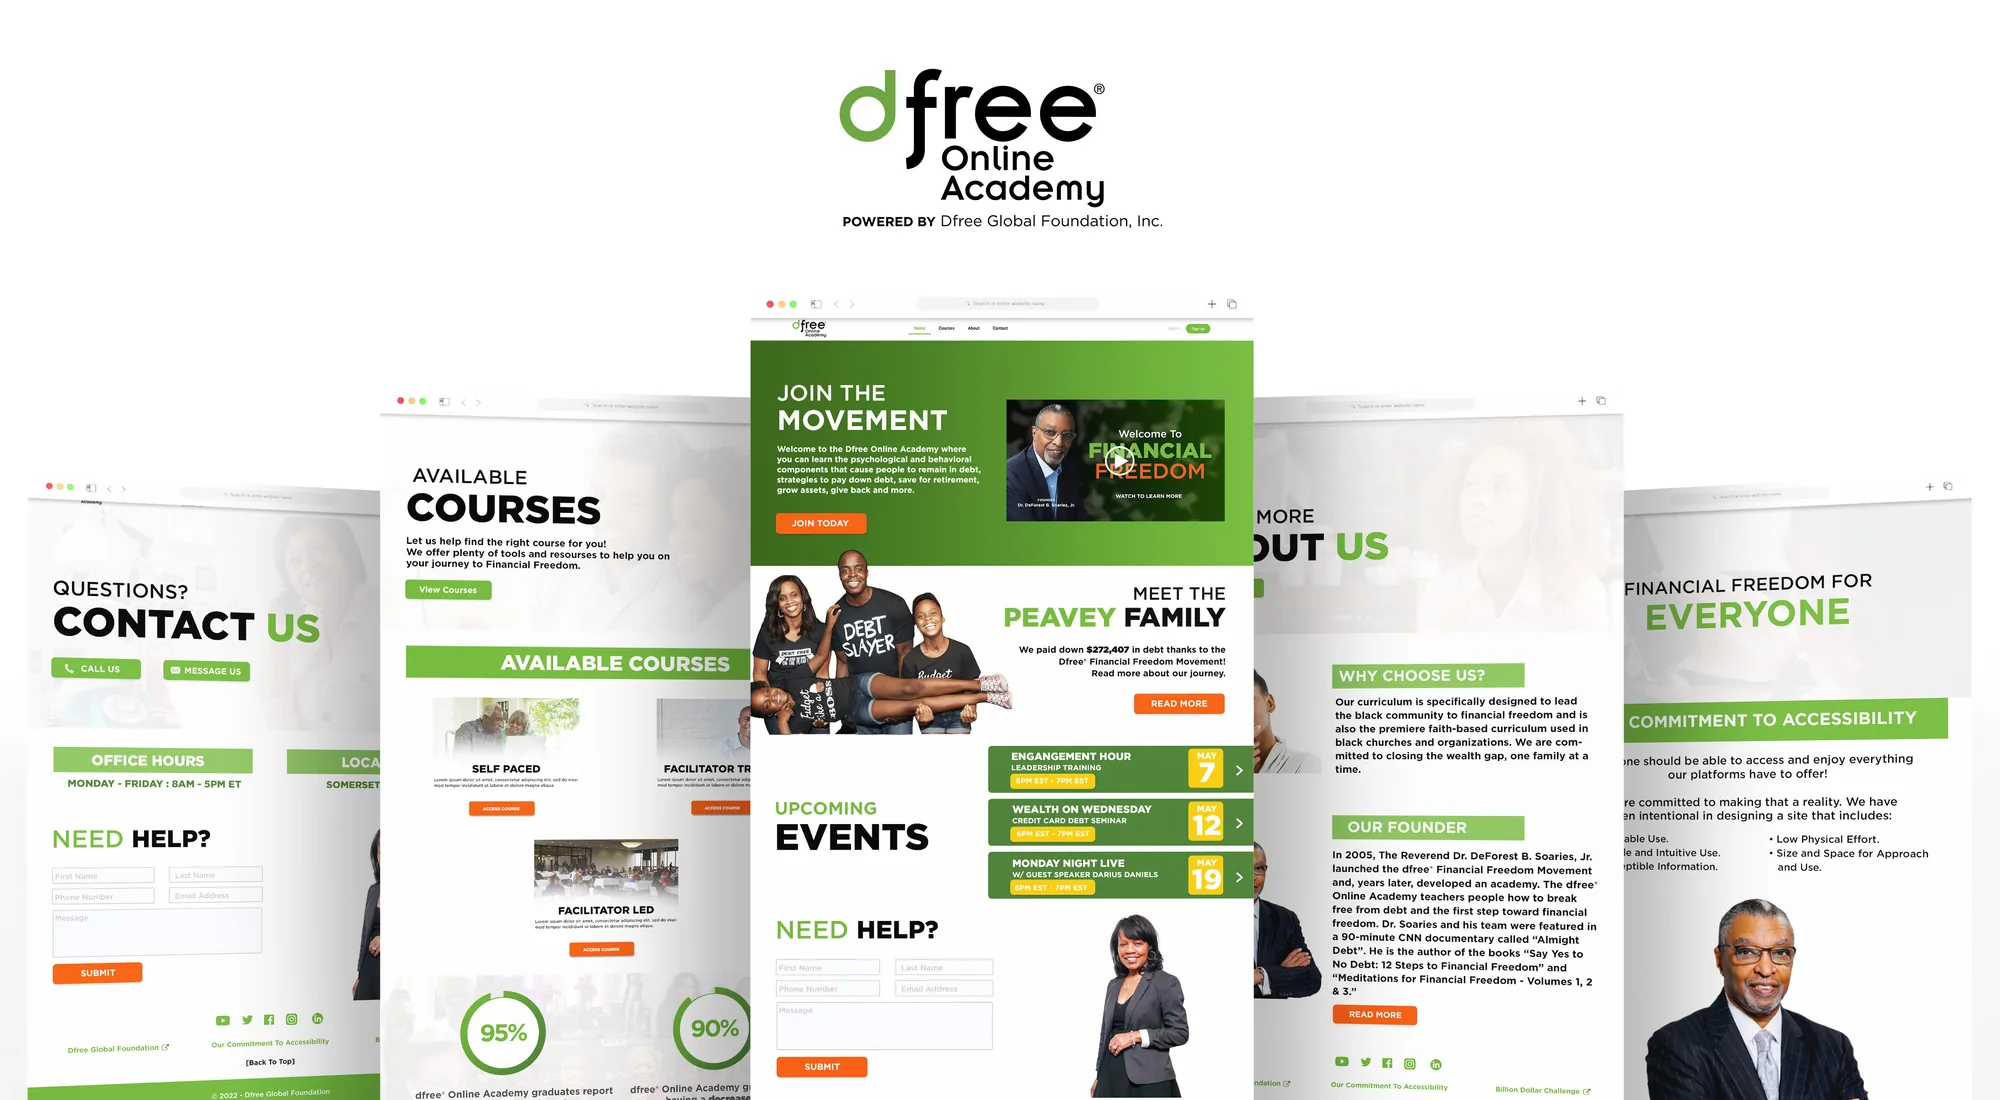
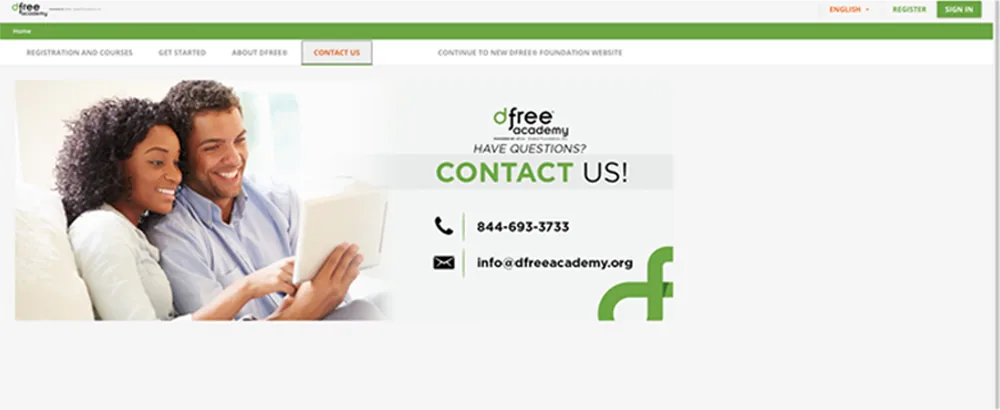
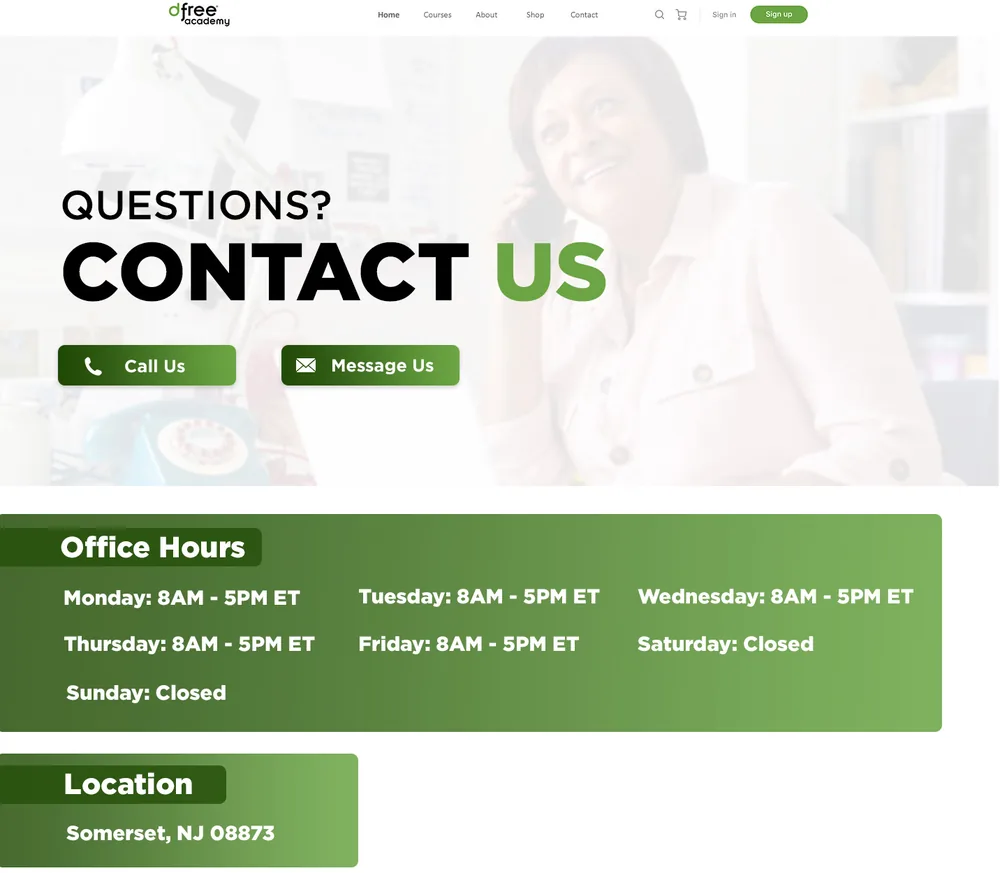
Enrollment was the clearest test of simplicity. For security reasons, the new enrollment flow needed more steps than the old one, not fewer. Even so, people completed it faster: average time on task went from 2 minutes 36 seconds to 1 minute 48 seconds. Fewer steps wasn’t the goal. A path people could follow was.
What I’d do differently
We did plenty of research at the start, and the say–do gap was the most important thing it found. But I didn’t carry that lesson far enough into the design process itself. I should have advocated for testing our ideas while we were still ideating, not only at the end. If watching people use the platform was what revealed the problem, watching them use our early solutions would have told us sooner which ones were working.
Did the redesign actually work?
The redesign looked different, but did we actually create a better design? We ran the same measures again:
- Time to enroll: 31% faster on average, from 2:36 to 1:48, despite the extra steps
- Lostness: down 38% on average
- System Usability Scale: 83, up 9 points from 74
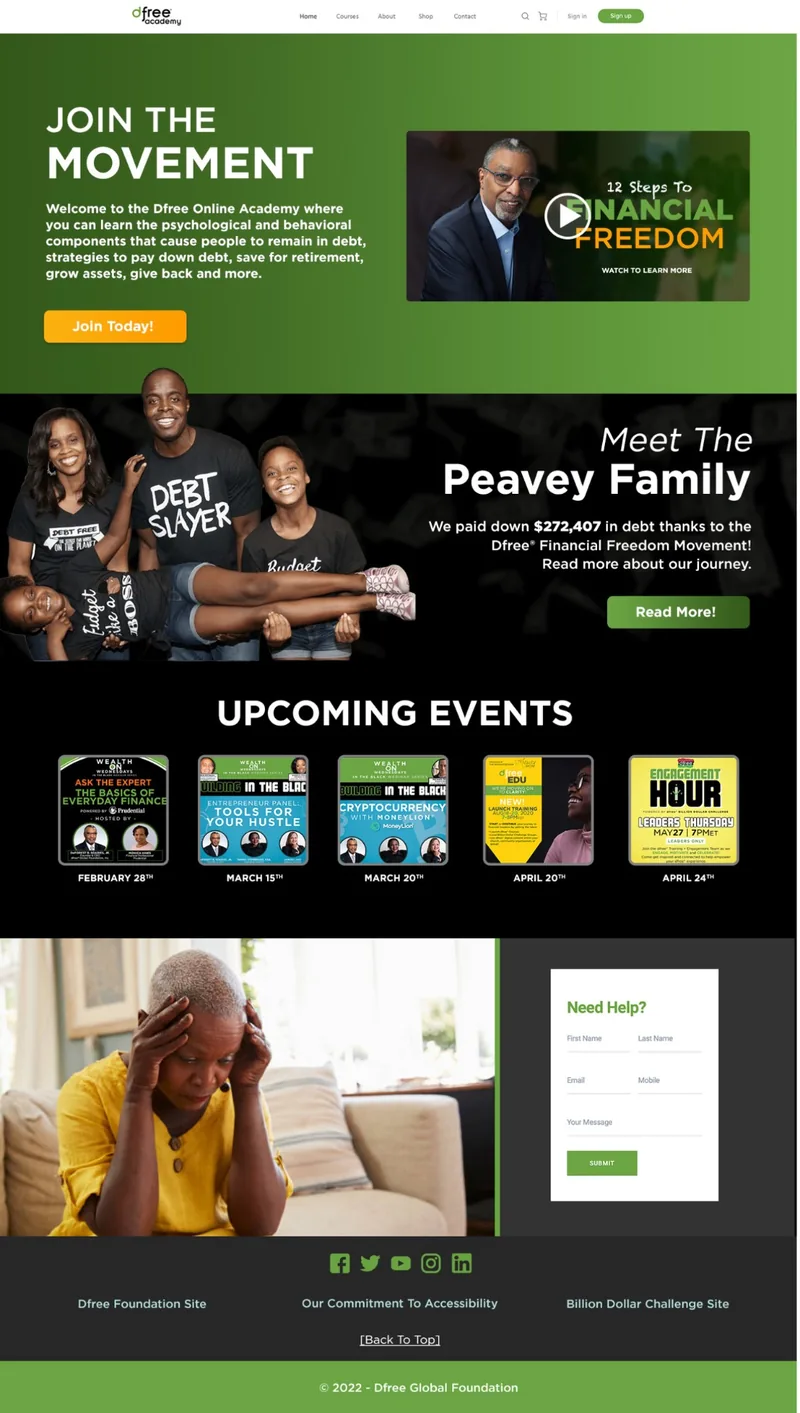
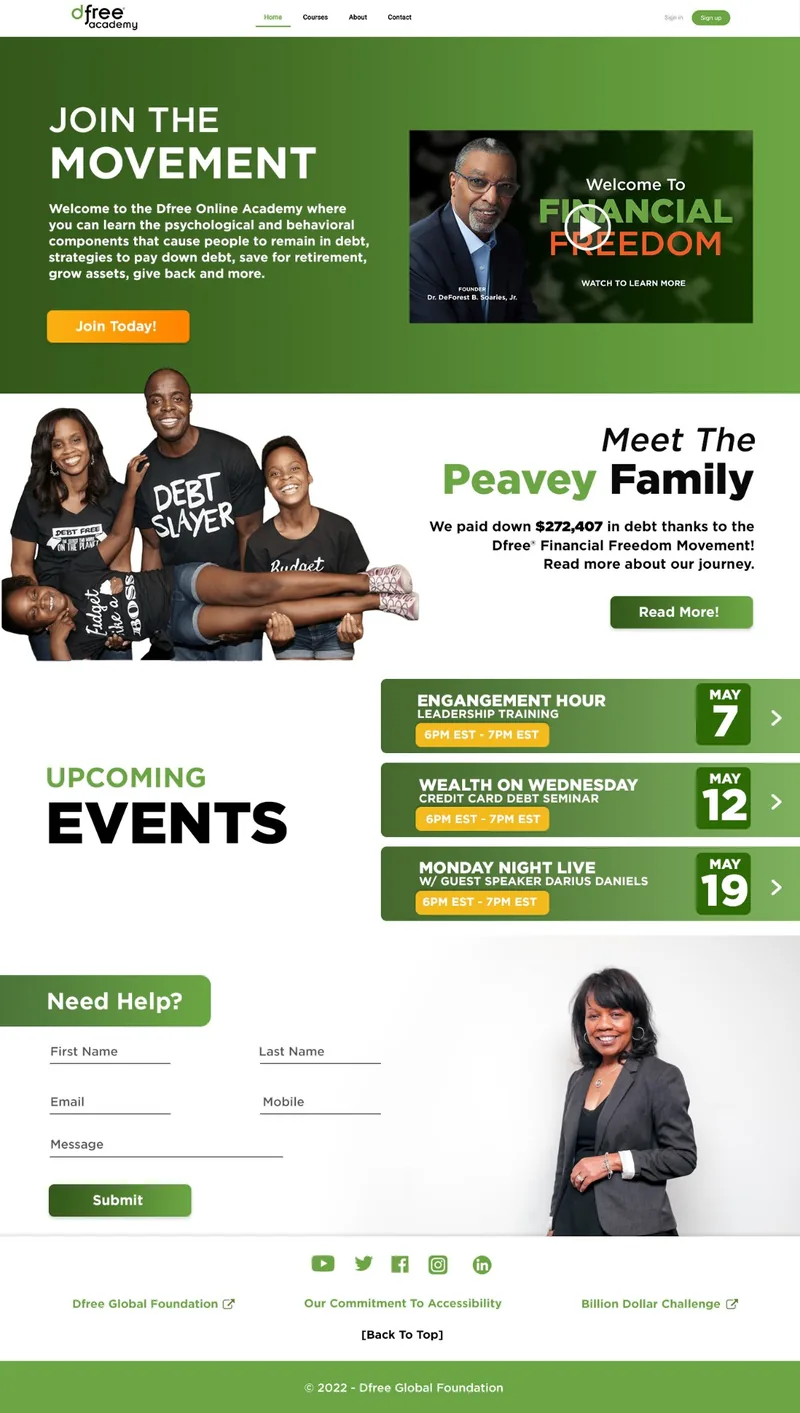
We also A/B tested dark and light versions of key screens. More people preferred the light screens, because they matched the theme of the dashboard and course screens they would spend the most time in.
What happened
The project ran about ten months, from December 2021, and the new platform launched at the beginning of October 2022.
What I can’t show yet is whether the redesign moved the numbers that started it: enrollment and graduation. The usability study shows people could find their way more easily. Whether more of them finished is a separate question, and the one I’d want answered next. Lostness also improved without reaching the goal of 0.40, so the path still wasn’t straight.
With more time and a larger budget, I would also have added more accessibility tools.
What I took away
It’s better to bring every stakeholder into the design process early. I don’t need to share every insight from research, only the ones that change the design. And when people tell you something is fine, watch them use it before you believe it.